Most social media reports look impressive and say very little. Thousands of impressions. Hundreds of likes. Follower count up 3.2% month-over-month. But when someone asks what social media is actually doing for the business, the answer is often a shrug.
The problem isn't a lack of data. It's tracking the wrong data — metrics that are easy to measure but weakly connected to anything that matters.
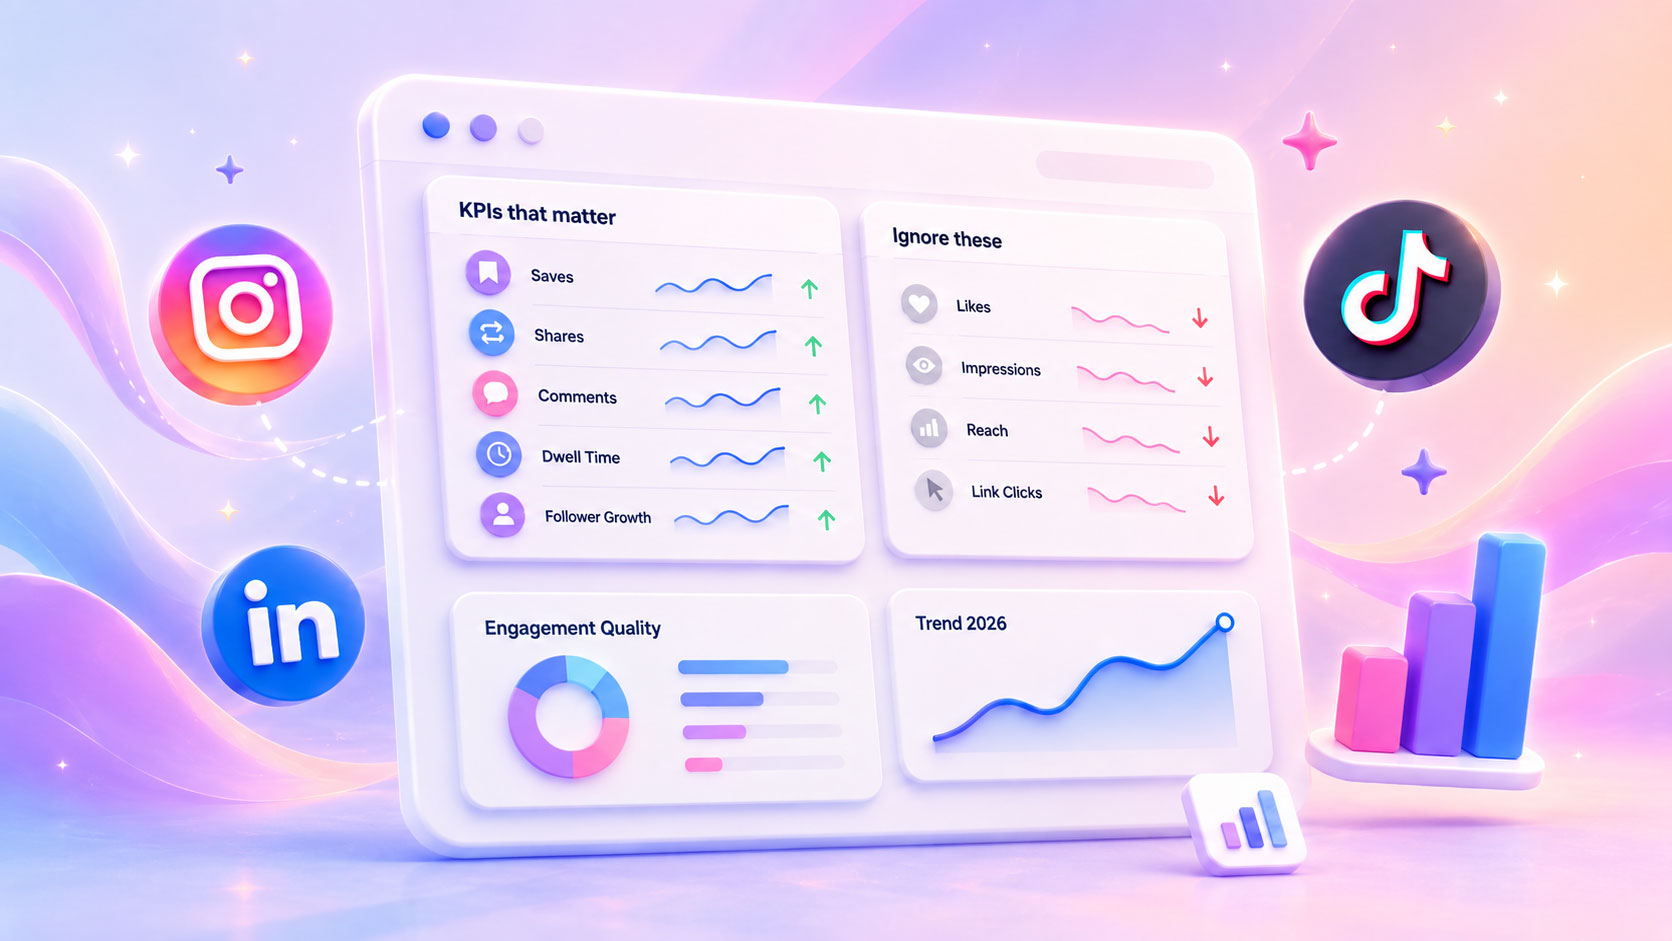
This guide breaks down which KPIs are worth your attention in 2026, which ones are noise, and how to build a reporting framework that tells the real story.
The Problem with Vanity Metrics
Vanity metrics are numbers that look good in a report but don't reliably predict business outcomes. They're not useless — but they're often misleading when treated as primary KPIs.
The classic vanity metrics:
- Follower count
- Total impressions
- Reach
- Likes
- Video views (without context)
- Profile visits
None of these are inherently bad to track. The problem is using them as success indicators when they don't tell you whether people actually care, remember, or act.
A post with 50,000 impressions and 200 likes says almost nothing. A post with 3,000 impressions, 180 saves, and 40 substantive comments says a great deal.
The KPIs That Actually Matter in 2026
1. Engagement Rate
What it measures: The percentage of people who saw your content and actively interacted with it.
How to calculate: (Total engagements ÷ Reach) × 100
Why it matters: Engagement rate normalizes for audience size, making it comparable across accounts and over time. A small account with a 6% engagement rate is outperforming a large account with a 0.8% rate — and the algorithm treats them accordingly.
Good benchmarks (2026):
- Instagram: 1–3% is average, 3–6% is strong, 6%+ is excellent
- LinkedIn: 2–4% is average, 4–8% is strong
- TikTok: 4–8% average (higher because of the discovery-first model)
2. Save Rate
What it measures: The percentage of viewers who saved your post for later.
Why it matters: Saves are the highest-intent engagement signal on Instagram and increasingly on other platforms. Someone who saves a post is saying: "This is valuable enough that I want to come back to it." That's a qualitatively different signal from a like, which often happens reflexively.
Save rate is also a strong predictor of algorithmic distribution. Instagram in particular treats saves as a signal that content deserves to be shown to more people.
How to track it: Saves ÷ Reach × 100. Anything above 1–2% on Instagram is performing well for most content types.
3. Comment Quality (Not Just Quantity)
What it measures: The substance of the conversation your content generates.
Why it matters: A post with 5 comments that are each 3+ sentences long, share opinions, and spark replies is algorithmically and strategically more valuable than a post with 50 "🔥" reactions. Platforms know the difference — and so should you.
How to track it: This one requires a human assessment. Review comments weekly: are they substantive? Do they reflect genuine engagement with the content, or are they low-effort reactions? The ratio of meaningful to surface-level comments tells you something about whether your content is actually resonating.
4. Share Rate / Forwards
What it measures: How often your content is shared to another person's network or forwarded in DMs.
Why it matters: Shares are the metric with the highest distribution multiplier. When someone shares your content, it reaches an entirely new audience that has zero awareness of your brand — organic discovery at its purest. It's also the strongest signal to most platform algorithms that content is worth distributing further.
What to watch: On Instagram, DM shares are particularly powerful for Reels. On LinkedIn, shares-with-comment are more valuable than silent reshares.
5. Link-in-Bio Clicks / Swipe-Up Actions
What it measures: Traffic driven off-platform from your social presence.
Why it matters: For brands with a conversion goal (newsletter signups, product pages, waitlist), off-platform traffic is one of the clearest connections between social content and business outcomes. If your content strategy isn't driving any traffic to your owned channels, it's worth asking why.
Caveat: Zero-click content strategies (which perform better algorithmically) mean this metric is deliberately low for many accounts. The key is knowing when you're optimizing for platform reach vs. direct conversion — and not treating low link clicks as failure when you've intentionally not asked for them.
6. Follower Quality Over Follower Growth
What it measures: The relevance and engagement level of your new followers, not just the number.
Why it matters: 1,000 new followers from a viral post about an unrelated topic are worth significantly less than 100 new followers who are exactly your target audience. In 2026, most experienced marketers have stopped reporting raw follower growth as a primary metric.
Better approach: Track follower growth alongside engagement rate. If follower count grows but engagement rate drops, you're attracting the wrong audience. If both grow, you're building something.
7. Watch Time and Completion Rate (Video)
What it measures: How much of a video people actually watch.
Why it matters: This is the primary ranking signal for video content on every platform. A 30-second video watched to completion beats a 3-minute video watched for 20 seconds — in algorithmic terms. Completion rate tells you whether your content delivers on its promise.
Targets: For short-form (under 60 seconds), aim for 50%+ completion rate. For longer content (1–3 minutes), 40%+ is strong. If completion rate is consistently below 30%, the issue is usually in the first 5 seconds — the hook is failing.
8. Conversion Metrics (Bottom of Funnel)
What it measures: Actions taken that directly connect to business goals — newsletter signups, product page visits, demo requests, purchases.
Why it matters: These are the metrics that actually justify social media investment to stakeholders. They're harder to attribute cleanly (especially for awareness-phase content), but they're the numbers that tell the business story.
How to connect them: Use UTM parameters on all links from social. Track which posts drove traffic that converted. Over time, patterns emerge — certain content types, topics, or CTAs reliably outperform others at the bottom of the funnel.
The Metrics to Stop Reporting (Or at Least Deprioritize)
Impressions without context. Impressions tell you how many times content was displayed — not whether anyone paid attention. Without engagement rate to contextualize it, impressions are nearly meaningless.
Raw follower count. Monthly follower growth as a headline KPI stopped being meaningful when follow/unfollow tactics and bought followers made the number unreliable. It's context, not a KPI.
Total likes. Likes are easy, fast, and reflexive. They're directionally interesting but too easy to game and too weakly correlated with actual outcomes to anchor a report.
Reach. Similar to impressions — tells you how wide the net was cast, not whether it caught anything.
Building a Reporting Framework That Means Something
The goal isn't to track everything — it's to track the right things consistently so you can see trends over time and connect them to what you're actually doing.
A practical monthly dashboard:
| Metric | Platform | What You're Watching |
|---|---|---|
| Engagement rate | All | Month-over-month trend |
| Save rate | Content resonance signal | |
| Top 5 posts by saves | What content to repeat | |
| Comment quality (qualitative) | Is content sparking real discussion? | |
| Completion rate | TikTok / Reels | Hook and content quality |
| Link-in-bio clicks | Traffic to owned channels | |
| Newsletter signups from social | All | Bottom-funnel connection |
Review this monthly, not daily. Daily metrics are noise. Monthly trends are signal.
How Content Quality Drives Every KPI
The common thread across every metric that actually matters — save rate, engagement rate, comment quality, completion rate — is that they all reflect whether content is genuinely good.
You can't optimize your way to a high save rate with posting time or hashtags. You earn it by creating content that people find genuinely useful, surprising, or resonant.
That's why the most effective teams in 2026 spend more time on content quality and less time on distribution tactics. And it's why a tool like capty — which helps maintain consistent brand voice and platform-appropriate formatting across every post — is more valuable than a scheduling hack. When quality is the variable that moves every metric, the tools that protect quality matter most.
Want to create content that actually moves the metrics that matter? Join the capty waitlist and get 10% Early Access discount.
Frequently Asked Questions
What is the most important social media KPI? It depends on your goal, but engagement rate is the most universally useful single metric — it normalizes for audience size, reflects content quality, and correlates strongly with algorithmic distribution. For conversion-focused strategies, link clicks and downstream conversion data matter more.
How often should I review my social media KPIs? Monthly for strategic decisions, weekly for operational adjustments. Daily metrics are too noisy to act on meaningfully — a single viral post or a quiet weekend can distort them completely.
What's a good engagement rate on Instagram in 2026? 1–3% is average for most business accounts. 3–6% is strong. Above 6% is excellent and usually indicates either a highly niche audience or content that's particularly resonant. Creator accounts typically run higher than brand accounts.
Should I track different KPIs for different platforms? Yes. Save rate is most meaningful on Instagram. Dwell time and comment quality matter most on LinkedIn. Completion rate and shares are the key signals on TikTok. Build platform-specific mini-dashboards rather than trying to use one universal metric across all channels.
How do I connect social media performance to revenue? UTM parameters on all links, consistent tracking in Google Analytics or equivalent, and regular reporting on which social posts drove traffic that converted. For awareness-stage content, direct attribution is hard — use proxy metrics like email signups or demo requests that can be tied to social campaigns.